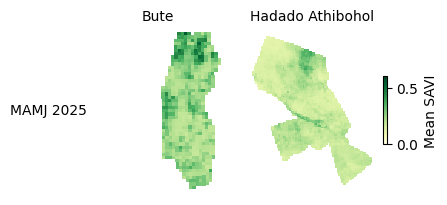
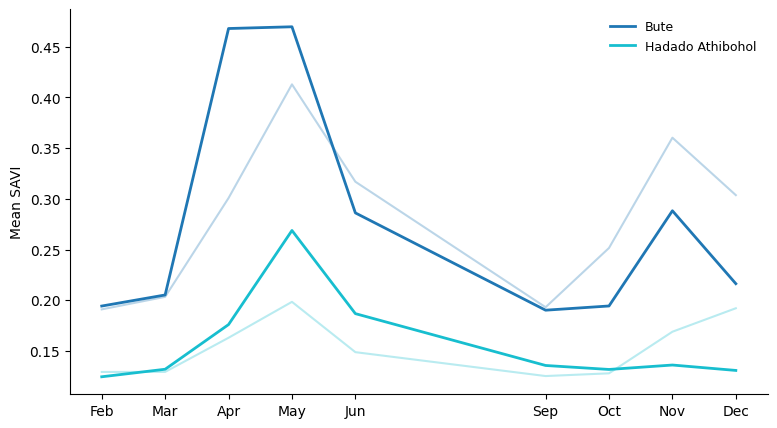
Greenness is a proxy for rangeland health. Bute is both greener than Hadado overall, and has a more rapid and more sustained green-up. A change in rate of change of greenness was the management signal we were hoping for.
1) Expand and evaluate: \(\displaystyle\sum_{i=3}^{6} 3i\)
2) Expand and evaluate: \(\displaystyle\sum_{i=2}^{5} (i^2 - 1)\)
3) Complete the following using sigma notation:
\[x_1 + x_2^2 + x_3^3 + \cdots + x_n^n = \sum\]
4) A climate model predicts daily high temperatures \(\hat{y} = [22, 25, 20]\) °C. Observed values are \(y = [24, 23, 21]\) °C. Calculate the mean squared error (MSE) using the formula:
1) Expand and evaluate: \(\displaystyle\sum_{i=3}^{6} 3i\)
2) Expand and evaluate: \(\displaystyle\sum_{i=2}^{5} (i^2 - 1)\)
3) Complete the following using sigma notation:
\[x_1 + x_2^2 + x_3^3 + \cdots + x_n^n = \sum\]
Solutions
✏️
4) A climate model predicts daily high temperatures \(\hat{y} = [22, 25, 20]\) °C. Observed values are \(y = [24, 23, 21]\) °C. Calculate the mean squared error (MSE) using the formula:
Linear algebra “branch of mathematics concerning linear equations” (Wikipedia), sometimes also described as the math of vectors & matrices.
It is a fundamental part of data science (and how computers understand & process data), and useful for describing environmental processes.
The building blocks of linear algebra
✏️
The building blocks of linear algebra
scalar: a value without direction, representing magnitude. For our purposes, a number:
\[8 \text{ or } \lambda.\]
vector: an ordered list of values, representing magnitude and direction (physics) or values for an observation or variable (data science). For example,
\[(1,3,5) \text{ or } (x_1, x_2, x_3).\]
matrix: am array of values made up rows and columns. For example,
Applications of linear algebra in environmental sciences
Dimensional reduction
Population matrix models
Optimization
Array programming / vectorized code
Machine learning
Let’s start with vectors
Where are vectors in EDS?
Let’s start with vectors
Where are vectors in EDS?
Everywhere.
Vectors are lists of values used to describe different features or variables of interest. For example, if you are trying to model fish size based on length (cm) and mass (g), then for a fish with length 32 cm weighing 281 g, you might describe that by:
\[(32, 281)\]
Sometimes vectors are represented with an arrow over the vector name:
\[ \vec{x} = (32, 281)\]
✏️
Let’s start with vectors
Where are vectors in EDS?
Everywhere.
Vectors are lists of values used to describe different features or variables of interest. For example, if you are trying to model fish size based on length (cm) and mass (g), then for a fish with length 32 cm weighing 281 g, you might describe that by:
\[(32, 281)\]
Sometimes vectors are represented with an arrow over the vector name:
\[ \vec{x} = (32, 281)\]
Often, we will think of an “abstract vector” \(x\) with \(n\)coordinates:
\[x = (x_1, x_2, \ldots, x_n).\]
Vector addition & subtraction
Just add or subtract the corresponding coordinates.
✏️
Vector addition & subtraction
Just add or subtract the corresponding coordinates.
If: \(u = (1, 2)\) and \(v = (3, -1)\), then:
\[u + v = (1+3, 2-1) = (4, 1)\]
What does this look like graphically? Let’s draw it!
Scalar multipliers
You can multiply any vector by a scalar (constant). This will not change the direction of the vector - it will only change the magnitude of the vector.
✏️
Scalar multipliers
You can multiply any vector by a scalar (constant). This will not change the direction of the vector - it will only change the magnitude of the vector.
Example:\(u = (1,2)\)
\[w = 3u = (3*1, 3*2) = (3, 6)\]
What does this look like graphically? Let’s draw it!
Vectors with > 3 coordinates
What about a vector with more than two coordinates? More than three?
Is as valid as describing a “point” in multivariate space as a vector with two “coordinates” – it’s just difficult for us to visualize and conceptualize since our brain only happily deals with 3 dimensions.
Dot product
✏️
Dot product
For vectors
\[x = (x_1, \ldots, x_n) \text{ and } y = (y_1, \ldots, y_n)\]
their dot product is:
\[x \cdot y = \sum_{i=1}^n x_i y_i\]
In words: The dot product is the sum of coordinates of each vector multiplied together. It is a measure of how close the vectors “point” in the same direction
Exercise
For vectors \(x = (x_1, \ldots, x_n)\)\(y = (y_1, \ldots, y_n)\) their dot product is:
\[x \cdot y = \sum_{i=1}^n x_i y_i\]
Find the dot product of \(a=(2,-1,0)\) and \(b= (9,3,-4)\):
✏️
Exercise
For \(a=(2,-1,0)\) and \(b= (9,3,-4)\):
\[ a \cdot b = (2)(9)+(-1)(3)+(0)(-4) =15\]
What happens when we have orthogonal vectors?
✏️ Sketch a quick graph, then find the dot product, of the following vector combinations:
1. \(a=(0,4)\) and \(b =(6,0)\)
2. \(x=(-3,1)\) and \(d=(2,6)\)
What is the value of the dot product for orthogonal vectors?
Dimensions: the size of the matrix, in rows x columns (m x n)
Elements: values in a matrix, often denoted symbolically with a subscript where the first number is the row and the second number is the column (e.g. \(a_{23}\) indicates the element in row 2, column 3)
Matrix algebra (add / subtract)
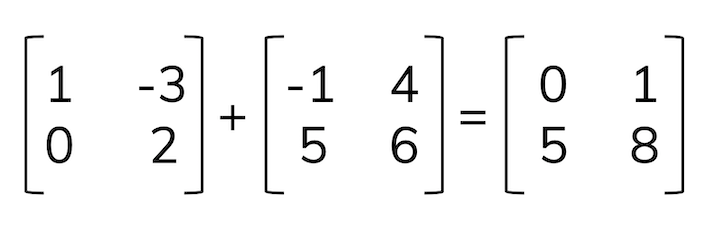
Add or subtract the corresponding elements (by matrix position) to create a new matrix of the same dimensions.
✏️
Matrix algebra (add / subtract)
Add or subtract the corresponding elements (by matrix position) to create a new matrix of the same dimensions.
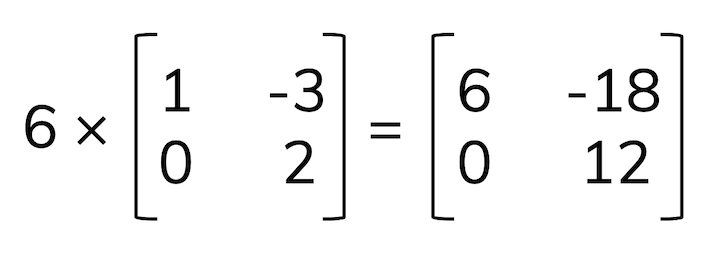
Scalar multiplication
To multiply a matrix by a scalar, multiply each element in the matrix by the scalar to get a scaled matrix of the same dimensions.
For example:
✏️
Scalar multiplication
To multiply a matrix by a scalar, multiply each element in the matrix by the scalar to get a scaled matrix of the same dimensions.
For example:
Recall: dot product
The dot product of two vectors is the sum of their elements multiplied:
For \(u =(1,5)\) and \(v = (2,-3)\):
\[u \cdot v=(1)(2)+(5)(-3)=-13\]
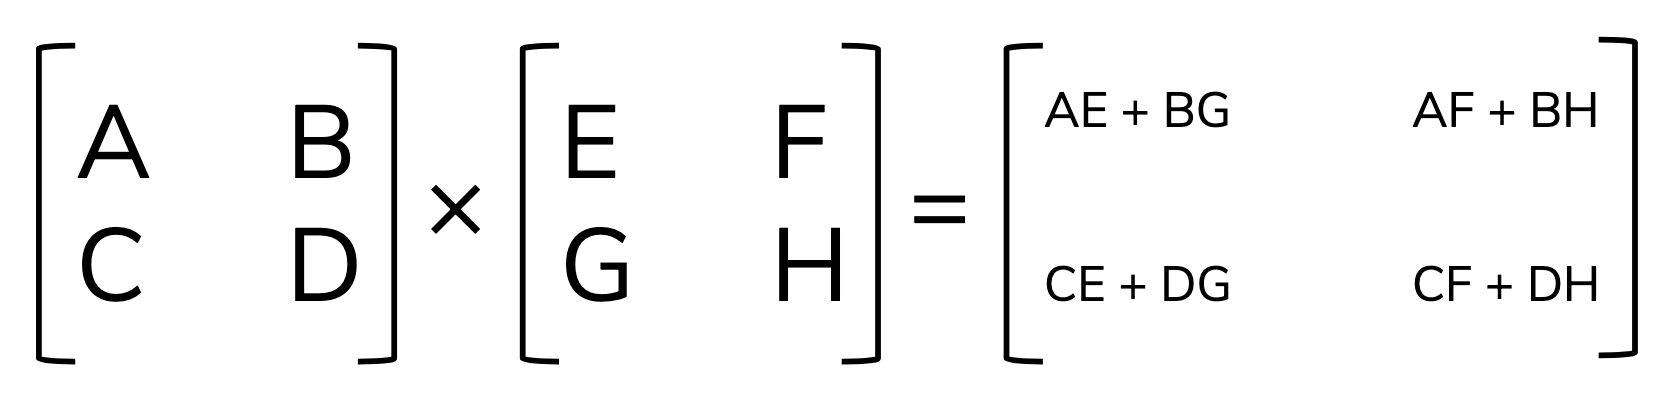
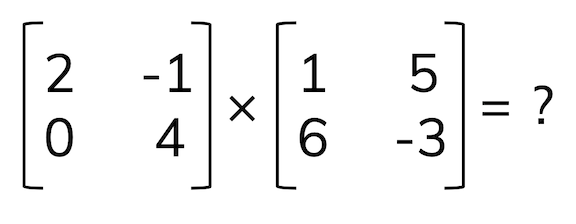
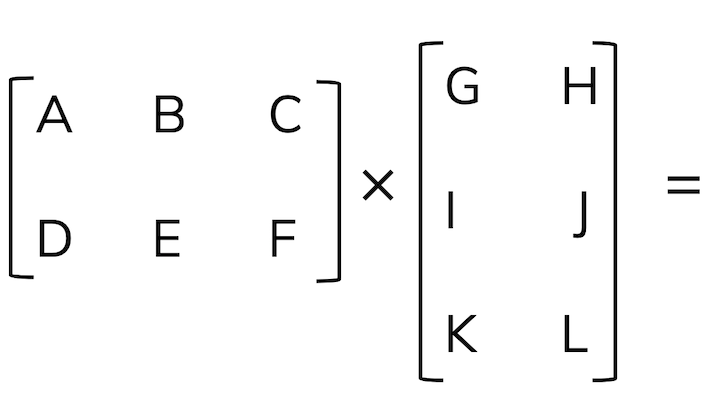
Matrix multiplication
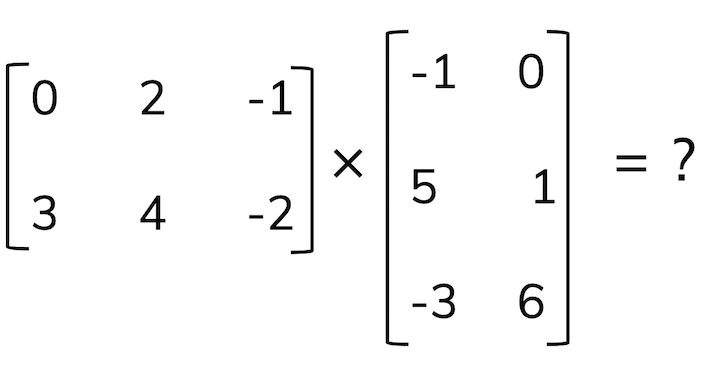
We find the dot product of row \(\cdot\) column vectors:
✏️
Matrix multiplication
We find the dot product of row \(\cdot\) column vectors:
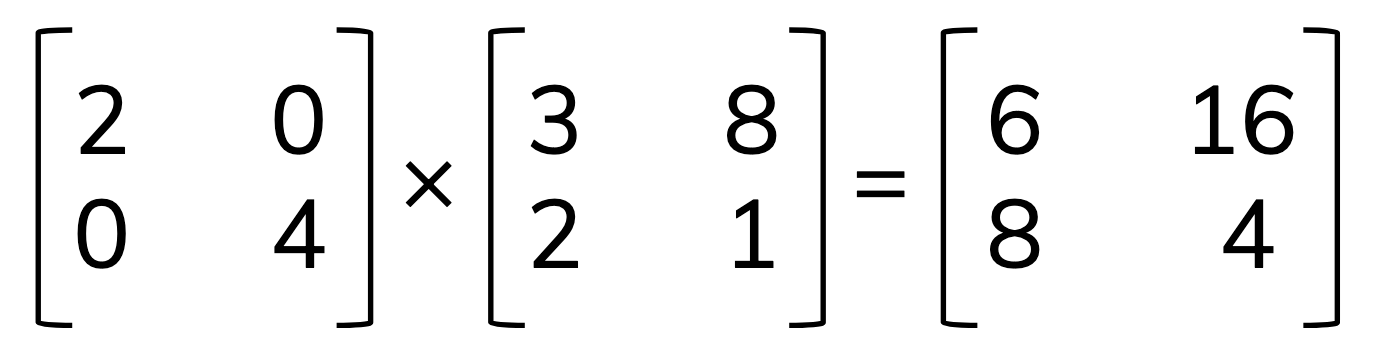
⚠️ You can multiply two rasters coordinate by coordinate, but matrices don’t admit this operation!
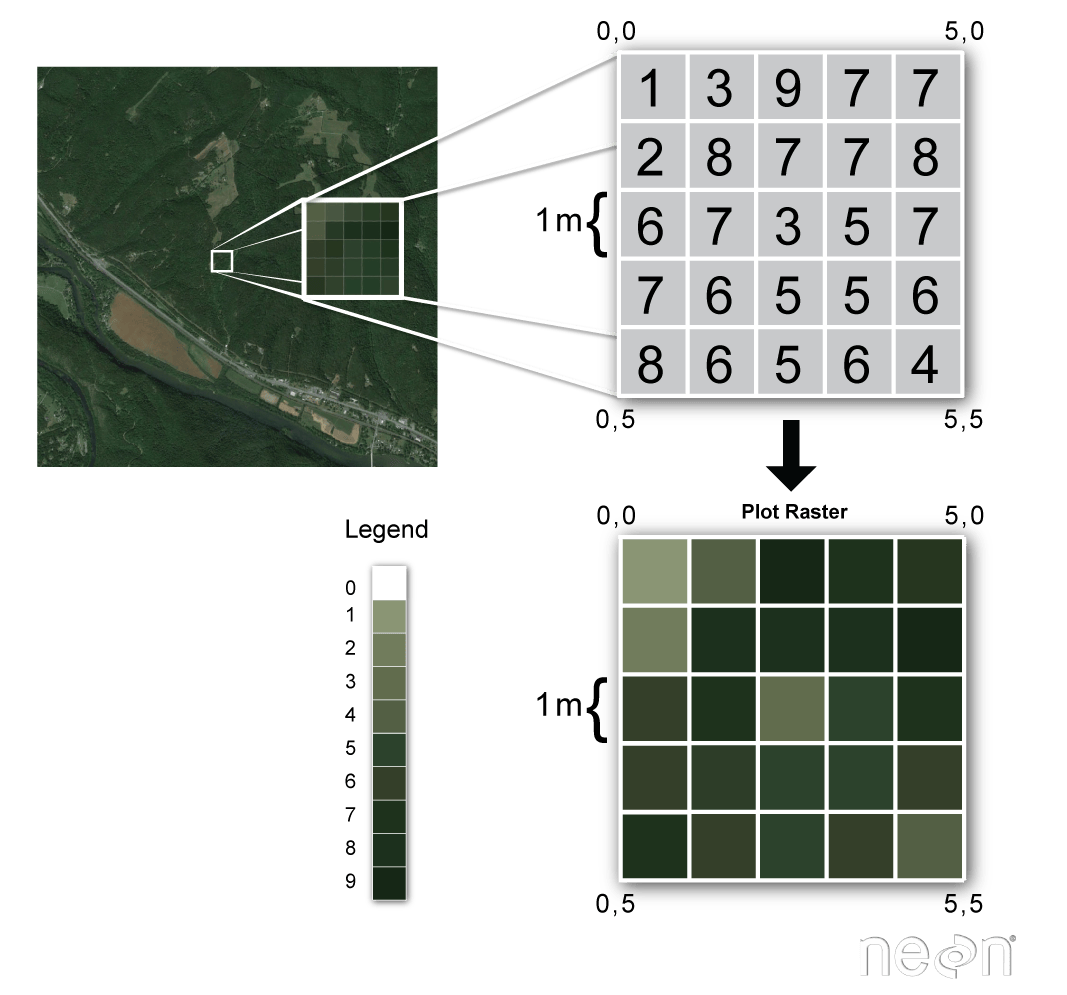
Exercise: combining rasters
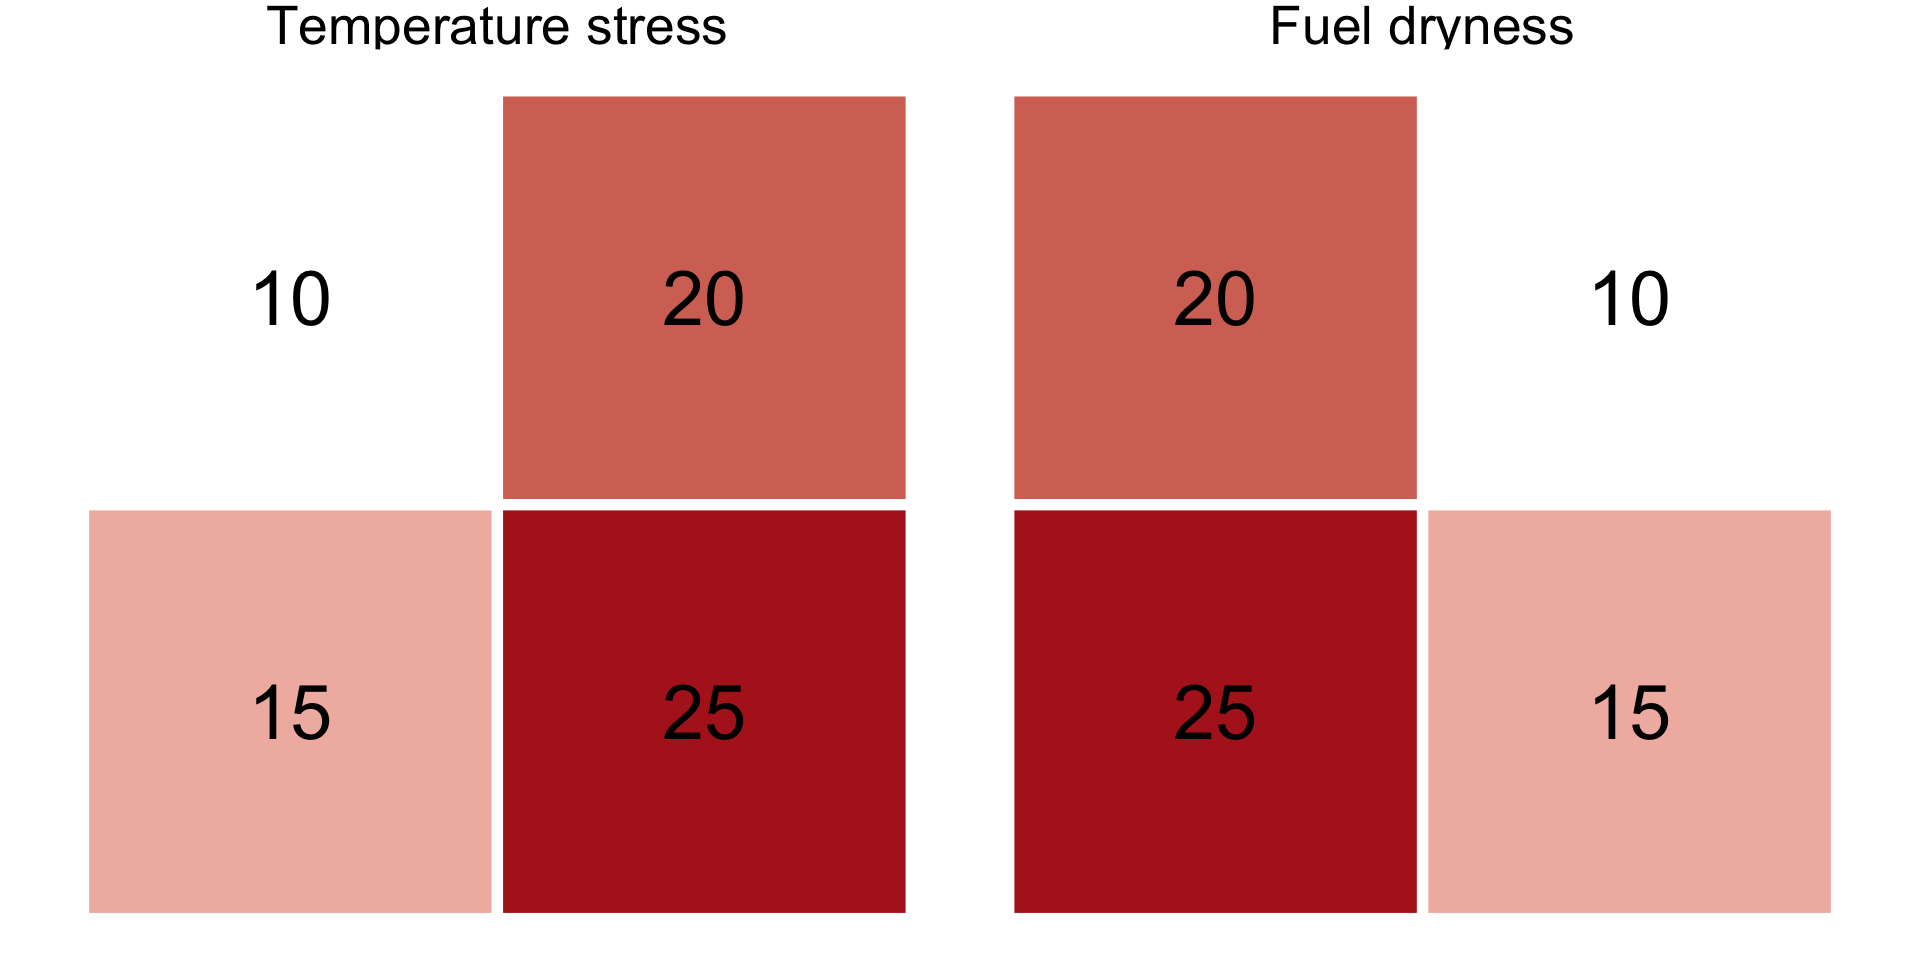
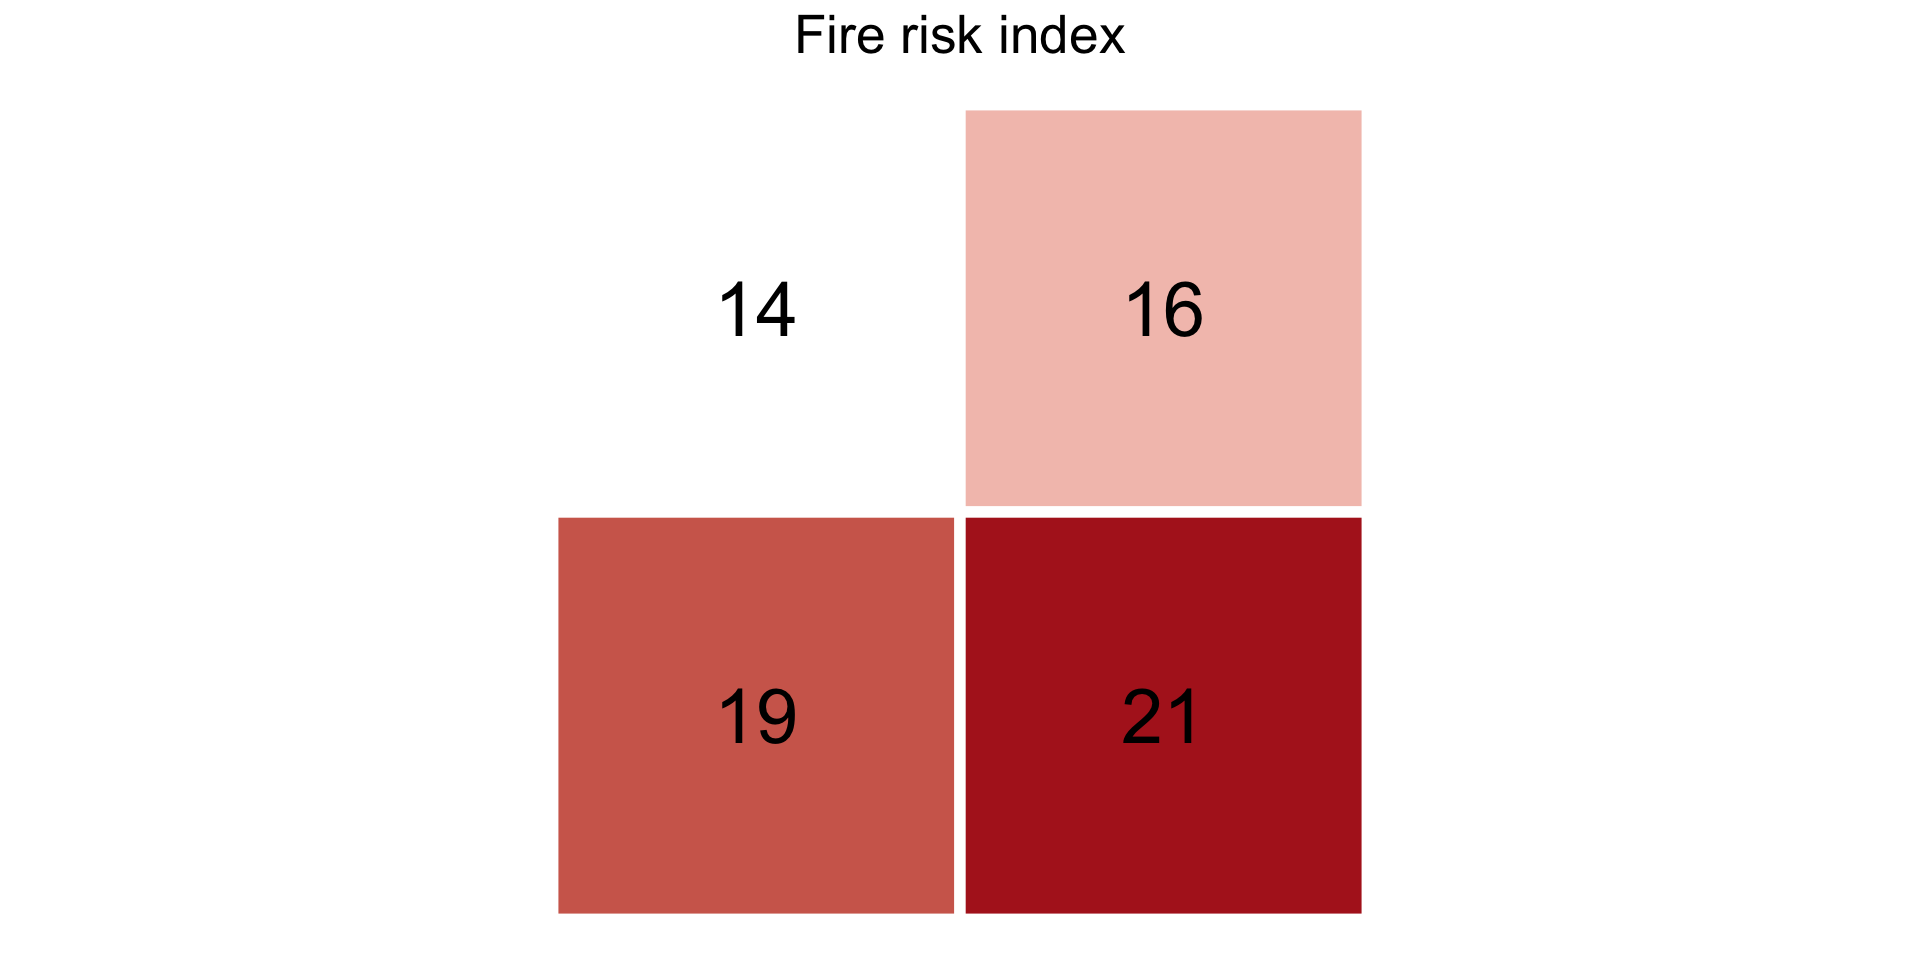
A raster is just a 2D array where each cell holds a value for a location on a grid. Land managers often combine several raster layers into a single index by scaling each layer (multiplying by a weight) and summing the results.