EDS 212: Day 1, Lecture 2

Exponential functions, logarithms, graphs, average slope


August 5th, 2024

Math brain warm up


  • Algebra blitz
  • Exponentials and logarithms
  • Common units and unit conversions
  • Functions
  • Understanding graphs
  • Interpreting equations

The Natural Exponential


In previous examples, we evaluated exponentials with different bases that were variables (e.g. \(x^5\)) and rational numbers (e.g. \(2^4\)).


Here, we’ll learn about the natural exponential, \(e\), which appears frequently in environmental science and modeling.

Where does \(e\) come from?


  • The value is from continuous compounding over infinite intervals:

\[\sum^{\infty}_{k=0} = 1 + x + \frac{x^2}{2!} + \frac{x^3}{3!} + \frac{x^4}{4!} + ...\]

  • The e is from Leonard Euler, Swiss mathematician who proved the value was irrational

\(e\) is a number, not a variable


\(e = 2.71828182845904523536...\)


It is an irrational number, yes - meaning it can’t be expressed by a simple ratio of integers - but a number nonetheless. With infinite decimal places.


It is always the same value.

Why is \(e\) so common?


  • One reason: Exponential trends show up a LOT in environmental science (the proportional change is the same over each time span)

  • Math reason: Turns out it’s a very useful value for calculus

    x            y  previous_y percent_change_y
1   1     2.718282          NA               NA
2   2     7.389056    2.718282         63.21206
3   3    20.085537    7.389056         63.21206
4   4    54.598150   20.085537         63.21206
5   5   148.413159   54.598150         63.21206
6   6   403.428793  148.413159         63.21206
7   7  1096.633158  403.428793         63.21206
8   8  2980.957987 1096.633158         63.21206
9   9  8103.083928 2980.957987         63.21206
10 10 22026.465795 8103.083928         63.21206
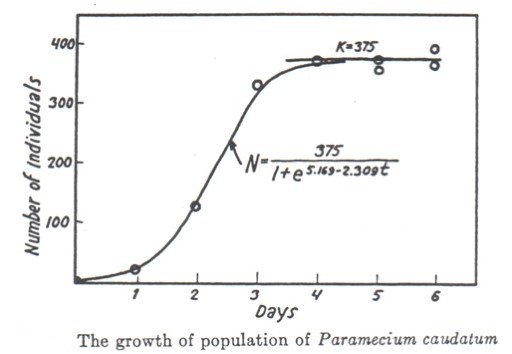
A real-world example:


But populations can’t grow exponentially forever . . .


Gause, G. F. 1934. The Struggle for Existence. Baltimore: Williams and Wilkins.

Logistic growth


\[N_t=\frac{K}{1+[\frac{K-N_0}{N_0}]e^{-rt}}\]


Where \(N_t\) is the population size at time \(t\), \(K\) is the carrying capacity, \(N_0\) is the initial population size, and \(r\) is a growth rate.


We should always think about why an equations has the shape it has - both conceptually and mathematically.

Logistic growth


\[N_t=\frac{K}{1+[\frac{K-N_0}{N_0}]e^{-rt}}\]


  1. Why might we expect logistic growth for many populations?

  2. What variables besides time would influence the actual population?

Logarithms


Logarithms ask a question: \(\log_a(b)\) asks “to what power do I have to raise \(a\) to get a value of \(b\)?


For example:

  • \(\log_2(8)\) asks “to what power do I have to raise 2, to get a value of 8?”

  • \(\log_x(x^{5.9})\) asks “to what power do I have to raise \(x\) to get a value of \(x^{5.9}\)?”

  • \(\log_{banana}(banana^{1382.95})\) asks “to what power do I have to raise \(banana\) to get a value of \(banana^{1382.95}\)?”

The natural log = “log base \(e\)” = \(\log_e()\) = \(ln()\)


So based on what we learned in the previous slide, what is:


  • \(\log_e(e^{10.4})\) = ?

  • \(\log_e(e^{2x+8.3})\) = ?

  • \(\log_e(e^{ax+2b^2-4.095})\) = ?

Some log rules


  • \(\log_x(AB)=\log_x(A)+\log_x(B)\)

  • \(\log_x(\frac{A}{B}) = \log_x(A)-\log_x(B)\)

  • \(\log_x(A^B)=B\log_x(A)\)

  • \(x^{\log_x(A)}=A\)

  • \(\log_x(1)=0\)

  • \(\log_x(x)= 1\)

Critical thinking questions


Can the value within a \(ln()\) expression ever be 0, or negative? Why?


Can the solution to a natural log expression ever be negative? How?

Working with \(ln()\) and \(e\) in equations


We can think of these as inverses of each other:

  • \(e^{\ln(x)} = x\)

  • \(\ln(e^x)=x\)


…and use that as a tool for escaping variables from exponents & logs (remembering we can do whatever we want to an equation, as long as we do the same exact thing to both sides)

Examples:


  • Find \(x\) given \(\ln(x) = 5\)

    Exponentiate both sides: \(e^{\ln(x)} = e^5\) ; simplify left-hand side to get: \(x = e^5\)


  • Find \(y\) given \(e^{3y}=95\)

    Take natural log of both sides: \(\ln(e^{3y})=ln(95)\) ; simplifies to: \(3y = \ln(95)\), so \(y = \frac{\ln(95)}{3}\)

Math brain warm up


  • Algebra blitz
  • Exponentials and logarithms
  • Common units and unit conversions
  • Functions
  • Understanding graphs
  • Interpreting equations

Graphs: visualizing & thinking about data


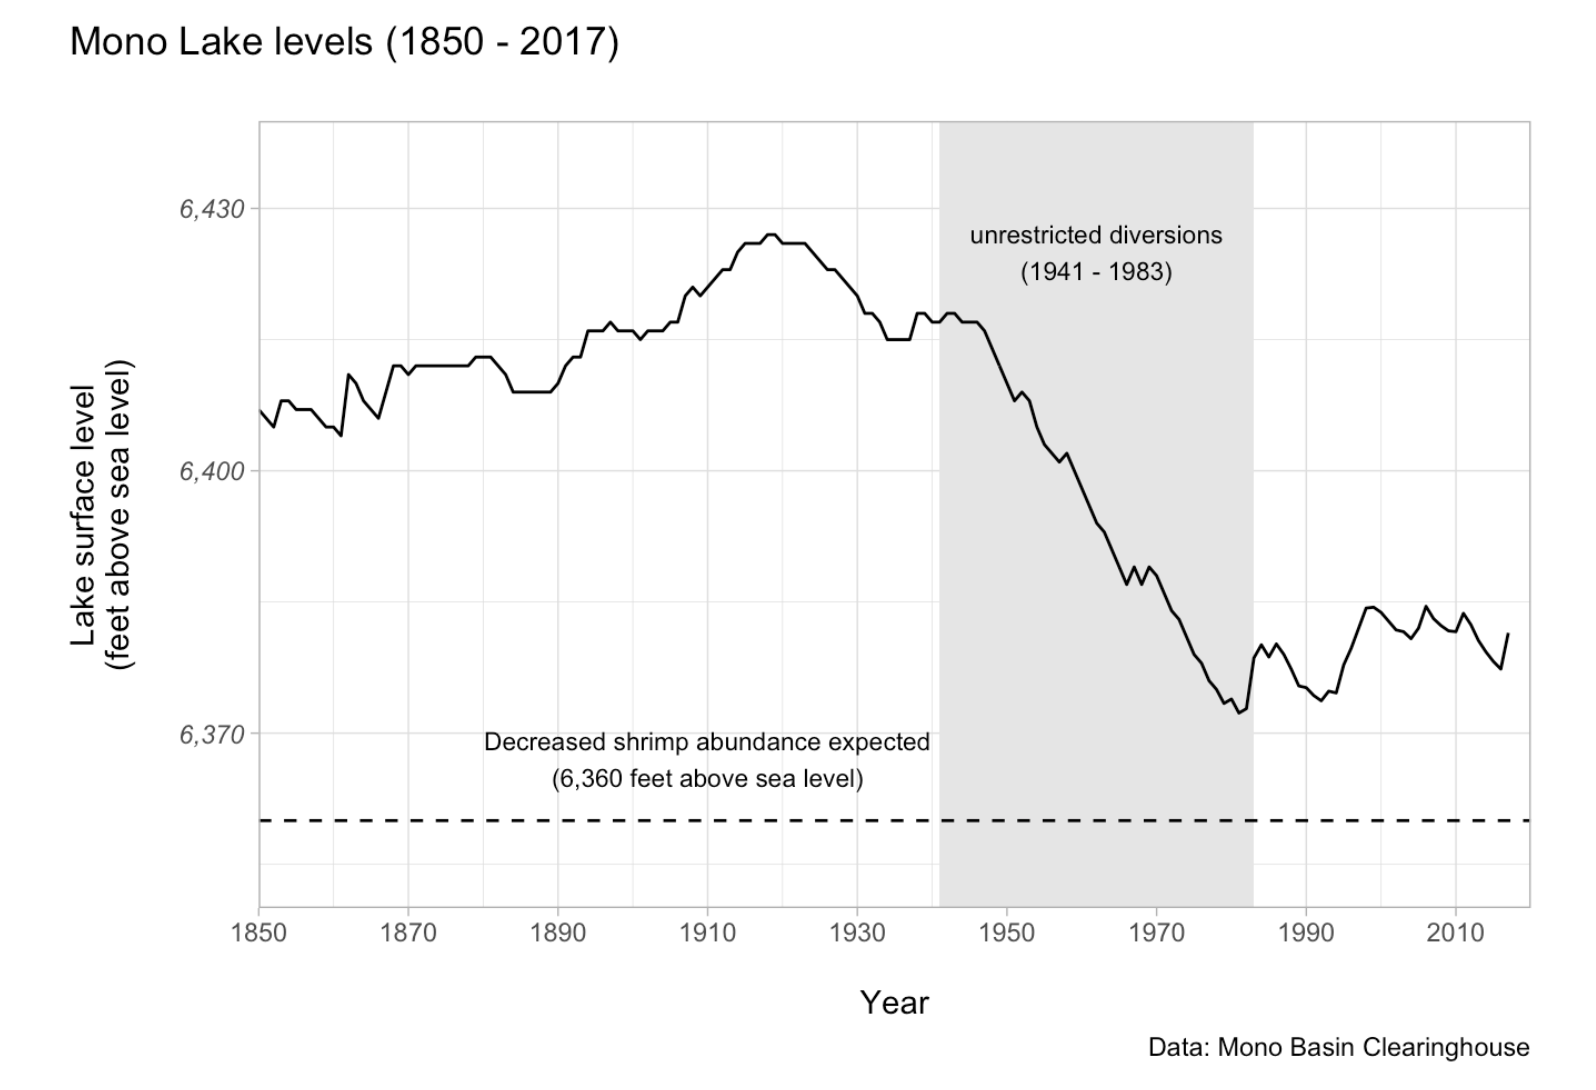
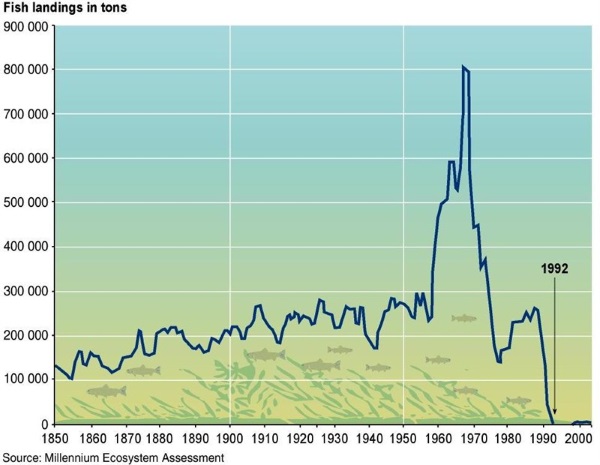
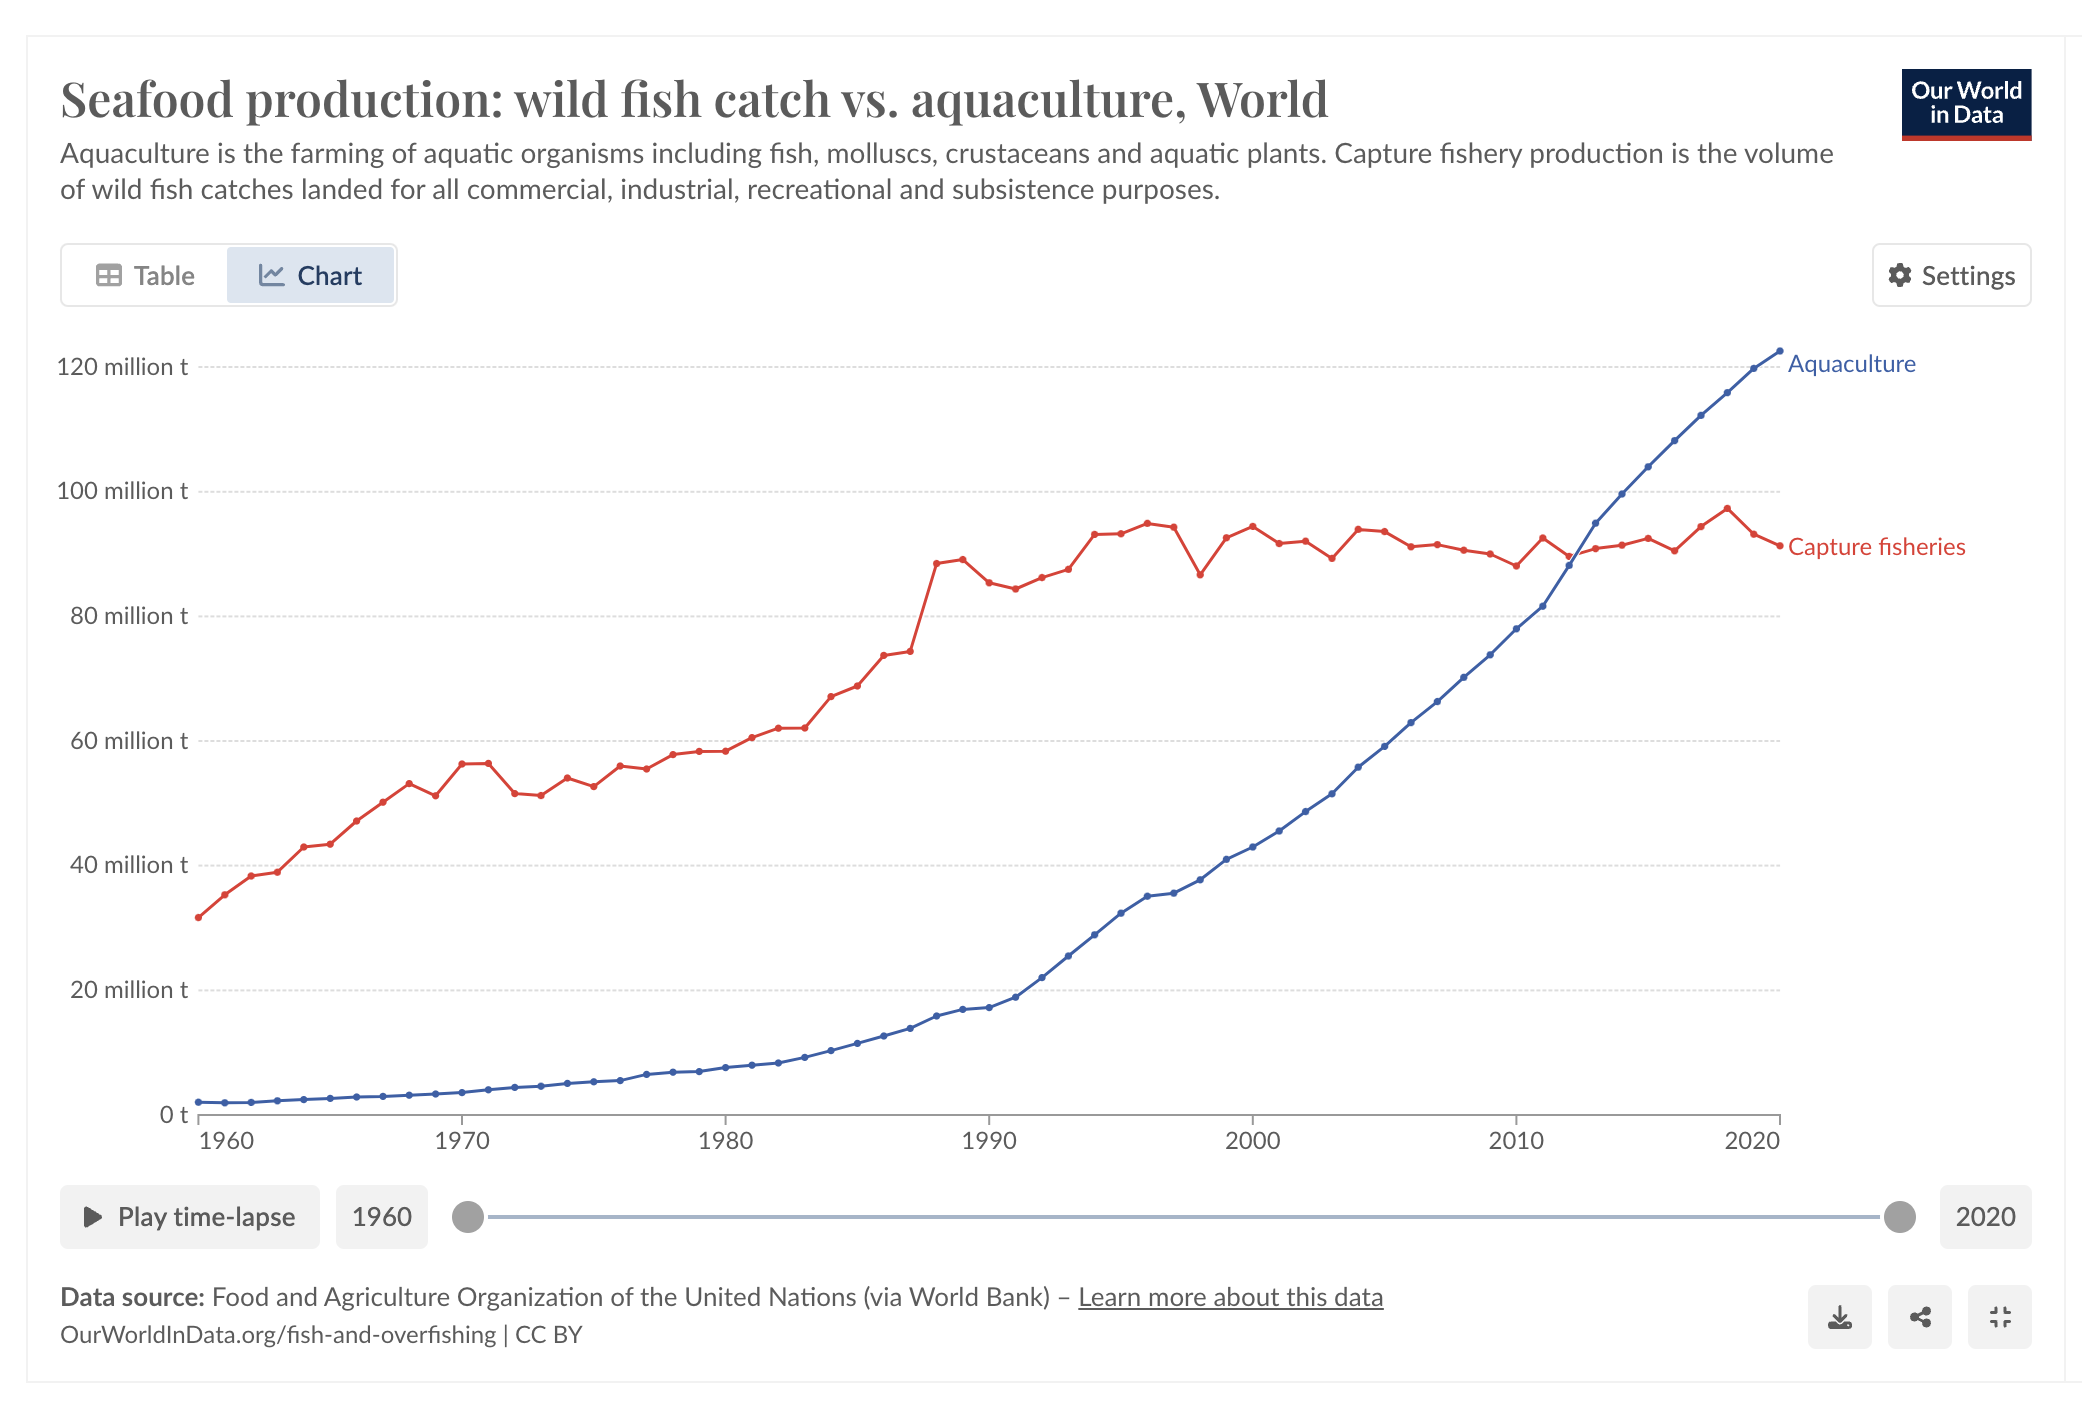
Graphs are a way for us to more easily process trends or patterns that may be more challenging to understand in a table or list.


When you look at graphs, the first things you should ask:

  • What variables are plotted (e.g. x- & y-axis, including units)?
  • What values are plotted (e.g. raw values, transformed, means, etc.)?
  • What are the overall takeaways and am I understanding them responsibly?

Practice saying these things OUT LOUD as if presenting the graph to an audience


“This figure shows the [change/pattern/relationship] between [x-variable], shown on the x-axis in units of [units] and [y-variable], shown on the y-axis in units of [units]. Overall [overall statement of pattern / trend / findings].”


Possibly with additional context as useful for the audience to put those findings into perspective (e.g. “this reduction represents an 82% decline in rainbowfish stocks along the Narnia Coast since 1991”).

Slope (average)


Sometimes, it can be useful to find the average rate of change of a function. Between any two points on a function \((x_1,y_1)\) and \((x_2,y_2)\) the slope is found by:}


\[m=\frac{\Delta y}{\Delta x}=\frac{y_2-y_1}{x_2-x_1}\]

Get into the practice of saying the meaning out loud


  • As if you’re explaining it to someone unfamiliar with the data
  • Including units
  • Without overstating certainty

For example:

“Between 1972 and 2020 the price of hobbit homes increased by an average of $2,450 per year”


differs from


“Between 1972 and 2020 the price of hobbit homes increased by $2,450 per year.”

The average slope of a continuous function rarely tells the whole story